Are you looking for a guide on how to build a web application for your data analysis project? Or are you just looking for a data science project to inspire your creativity? Then, if your answer is “Yes,” this step-by-step guide is for you.
You have come to the right place! Here we guide, inspire, and motivate people to venture into data science and ML. Note that ML is the acronym for Machine Learning. Having said that, let us move on with the project.
Web App Name:
The Ultimate Career Decision-Making Guide: – Data Jobs
Tagline:
Navigating the Data-Driven Career Landscape: A Deep Dive into Artificial Intelligence (AI), Machine Learning (ML), and Data Science Salaries.
1.0. Project Recap – Phase 1
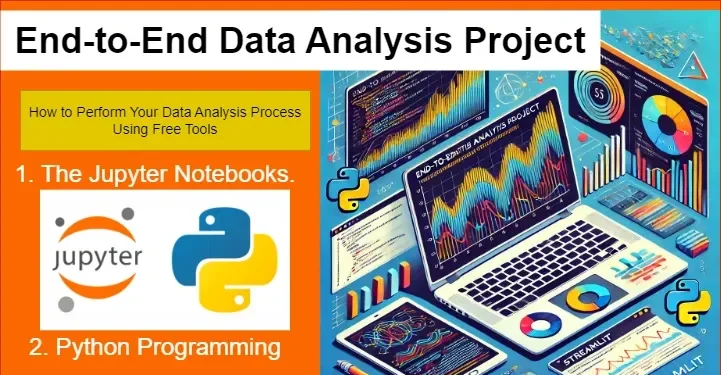
As you can remember from the introductory part, I divided the project into two parts. In phase one, we worked on the End-to-End data analysis using Jupyter Notebook. As mentioned earlier, it formed the basis for this section – web application development.
Thus, to remind ourselves, I performed the explorative data analysis (EDA) process in step 1. Then, data preprocessing in step 2. Finally, step three visualized the the data in details. Thus, the nine key dimensions for this phase came into existence. They support the creation of the web application to share insights with you and the world.
In case you have not read our first tutorial, here it is: How to Create a Simple Data Analysis Dashboard Using Python and Jupyter.
1.1. What to expect in this web application building guide
A step-by-step guide on how to design and develop a basic web application for your data science project. By the end of the guide, you will learn how to use Streamlit and GitHub repository to create an excellent web based application. Thus, you will gain skills, confidence, and expertise to come up with great web apps using free and readily available tools.
1.2. Challenges hindering people from venturing into AI, ML, and data science
Today, there are different challenges that hinder people from venturing into the fields of Artificial Intelligence (AI), Machine Learning (ML), and Data Science. One primary challenge individuals face is understanding the nuanced factors that influence career progression and salary structures within these fields.
Currently, the demand for skilled professionals in AI, ML, and Data Science is high. But, so is the competition. For example, 2024 statistics show that job postings in data engineering have seen a 98% increase while AI role postings have surged 119% in 2 years. Additionally, 40% or 1 million new machine learning jobs will be created in the next five years.
Therefore, these industry and market trends show an increase in demand for AI, ML, and Data Science. The growth needs more experts and professionals. Thus, it is necessary to act now to join and take advantage of the trends. But how do you do that? The question will answered in the subsequent sections of this guide.
Navigating the tech careers landscape requires a comprehensive understanding of how various elements, such as years of experience, employment type, company size, and geographic location, impact earning potential. That is why I developed this solution for people like you.
1.3. Possible solution to address the challenges
To address these challenges, the project embarks on a journey to demystify the intricate web of factors contributing to success in AI, ML, and Data Science careers. By leveraging data analytics and visualization techniques, we aim to provide actionable insights that empower individuals to make informed decisions about their career trajectories. Keep it here to learn more. Next, let us look at the project objective.
1.4. The project’s phase 2 objective
The goal is to create a simple web application using Streamlit to uncover patterns and trends that can guide aspiring professionals. The application will be based on the comprehensive visualizations highlighting salary distributions prepared in phase 1 of the project.
2.0. Project phase implementation
First, before we get our hands dirty in developing the web app, let me take you through some important tools and project details. They will contribute to your understanding and comprehension of the building process for effective results.
In this regard, we shall first look at a Web Application, Streamlit Library, VSCode, and the Analytical Dimensions found in the web application. After laying the ground, we shall head straight to creating the application using these tools. Thus, let us dive into details by first answering the question What is a web application.
2.0.1. What is a Web Application?
In technology, a web application is a software program that runs or operates in our web browsers. For example, the one you use right now on my PC is Google Chrome. Today, in the web browser landscape, there are many examples of browsers made for different operating systems and user needs.
Some examples of browsers include Google Chrome, Mozilla Firefox, Apple Safari, Brave, Opera Mini, and Kiwi, among others. You choose a browser depending on your usage needs, device, and operating system. For example, one browser may work better on an Android mobile device than on your desktop PC. In my case, I use Google Chrome as my first option, followed by Brave.
Unlike traditional desktop applications, which require installation on a local machine, web applications are accessed via the internet. Secondly, they can be used from any device with a functional browser. Web Apps are built using a combination of frontend and backend technologies. Such techs include HTML, CSS, JavaScript, and server-side frameworks like Flask or Django for Python.
For data science projects, web applications provide an interactive way to present analyzed data. So, instead of sharing static reports or Jupyter notebooks, you can build a web app that allows users to:
- Interact with your data models,
- Visualize trends, and
- Make data-driven decisions.
Are you worried about your little or no coding skills and knowledge? Do not worry anymore. I have something good to cheer and motivate you to start building stunning web applications. The good news is that tools like Streamlit make it easy to build such applications. Thus, you do not need deep web development knowledge to get started. I will tell you more about Python Streamlit in the next section. Also, I will take you through how it works for your good.
Let us get started.
2.0.2. The Streamlit library in Python
Generally, Streamlit is a Python library that simplifies the process of building interactive web applications for data science and ML projects. For example, in this project, I used it for a data science project. It allowed me as a developer to create dynamic and intuitive user interfaces directly from Python scripts without needing additional HTML, CSS, or JavaScript.
With Streamlit, users can easily visualize data, create interactive charts, and incorporate machine learning models into web applications with minimal code. For example, I used several Python functions in this project to generate insights from visualizations. Then, I presented them in a simple web application.
This library is particularly beneficial for data scientists and developers who want to share their work or deploy models in a user-friendly manner, enabling them to prototype ideas and create powerful, data-driven applications quickly. This statement describes my project’s intentions from the beginning to the end.
2.0.3. What is VSCode?
VSCode is the acronym for Visual Studio Code. It is a free, lightweight, and powerful code editor developed by Microsoft. It supports multiple programming languages. Some examples include but not limited to, Python, R, and JavaScript. Thus, VSCode’s capabilities to support many languages make it an excellent choice for data science and web development projects. Key features of VSCode are:
- Integrated Terminal. Run Python scripts, manage virtual environments, and execute Streamlit commands directly within VSCode.
- Extensions Marketplace. Install plugins for Python, Jupyter Notebooks, Git, and more to streamline your workflow.
- IntelliSense. Smart code suggestions and autocompletion make coding faster and more efficient.
- Git Integration. Version control is built-in, making it easy to track changes and collaborate on projects.
For building a Streamlit web application, VSCode is an ideal environment. With it, you can write your Python code, manage dependencies, preview your application, and deploy it. The best part of it all is that all the activities are done and completed from a single workspace.
Now that we understand the basics of web applications and VSCode, let us dive into how to use Streamlit to build a simple yet powerful data-driven web app.
2.1. Key Analytical Dimensions in the Web Application
As listed below, based on project phase 1 data visualizations, I generated nine insights. Each analytical dimension is accompanied by a code snippet. They were developed to provide insights into the web application interface.
After reading them, click the link at the end of the post to visit the deployed application. Thus, from it you will confirm and approve my great work with Streamlit Library.
- Employment Type. Unraveling the nuances of salaries in full-time, part-time, contract, or freelance roles.
- Work Years. Examining how salaries evolve over the years reported in the dataset.
- Remote Ratio. Assessing the influence of remote work arrangements on salaries.
- Company Size. Analyzing the correlation between company size and compensation.
- Experience Level. Understanding the impact of skill proficiency on earning potential.
- Highest Paid Jobs. Exploring which job category earns the most.
- Employee Residence Impacts on Salary. Investigating the salary (KES) distribution based on the country where the employee resides.
- Employee Residence Impacts on Salary. Investigating the salary (KES) distribution based on the country where the employee resides.
- Company Location. Investigating geographical variations in salary structures.
- Salary_in_KES. Standardizing salaries to a common currency for cross-country comparisons.
2.2. How to create a web application using VSCode
With just a few steps, you can have your web application up and running. For example, in my project I used only six steps. Note that there is no specific number of steps set as the standard. In other words, it depends on your project complexity and creativity. Based on this guide, you can replicate the steps to jumpstart your project journey.
2.2.1. Step 1: Importing the necessary libraries.
The first thing to do is import the Python libraries required to load and manipulate data.
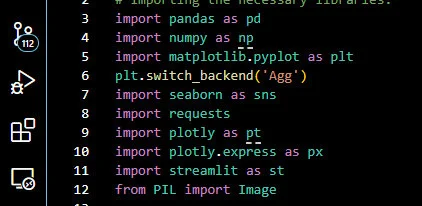
These are the same libraries used in the end-to-end data analysis process in phase 1 of the project. It is important to note that Streamlit has been added to the requirements list.
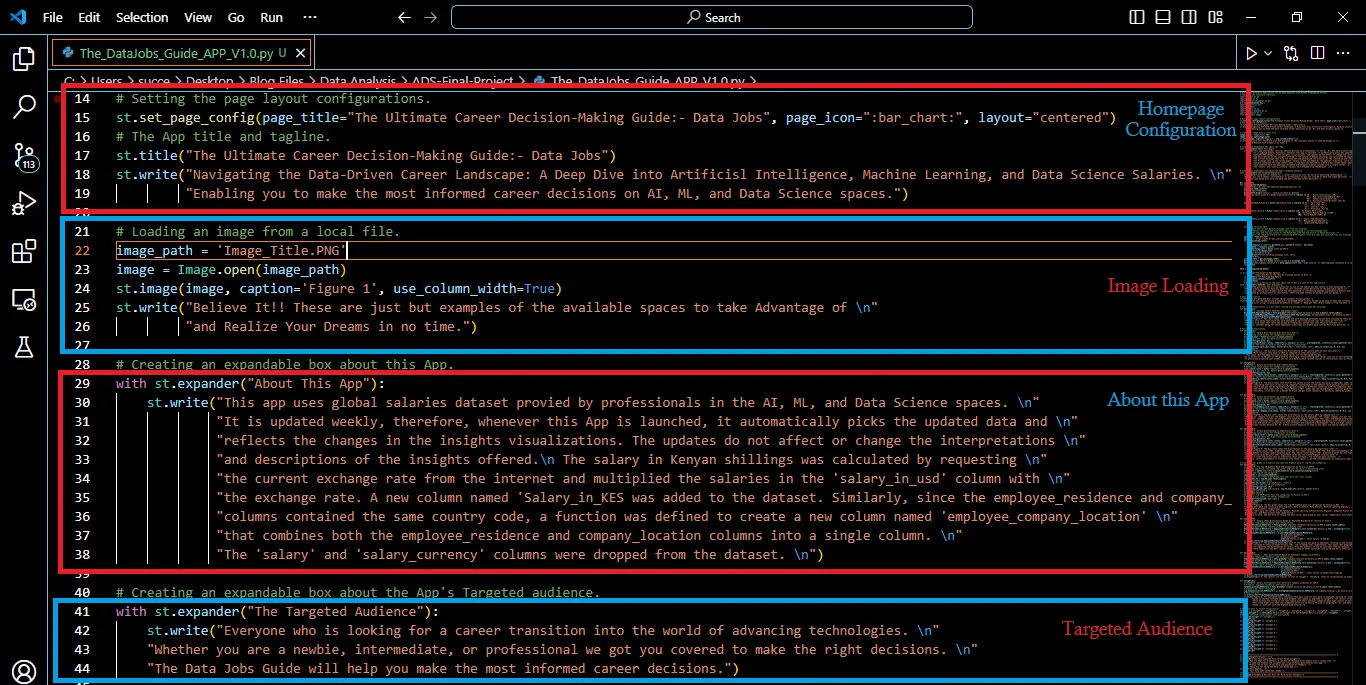
2.2.2. Step 2: Setting the page layout configurations.
Next, I designed the application interface using the code snippet below. I defined and set the application name and loaded the image on the homepage. The image was stored in my local computer disk. Also, I created the “Targeted Audience” and “About the App” buttons.
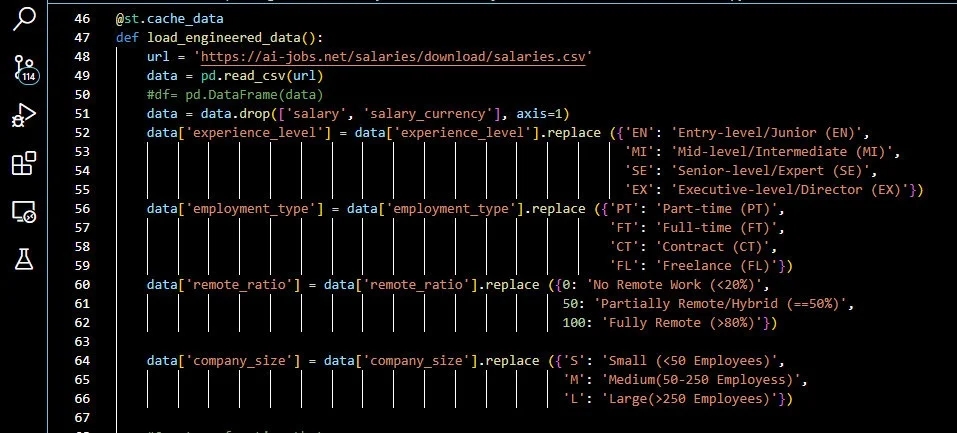
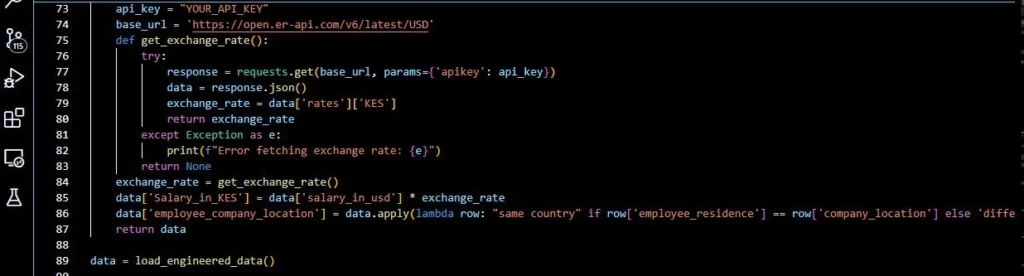
2.2.3. Step 3: Loading the engineered data into the Web Application.
After creating the web application layout, I proceeded to load the data along with the newly engineered features. The two code snippets below show how to load data in Streamlit. They also ensure that the data remains the same every time it is loaded.
NOTE:
The two screenshots shows one piece of code on the same working area in VSCode studio. Thus, the screenshot was split to capture all details clearly.
2.2.4. Step 4: Creating the “Raw Data” and “Warning: User Cases” display buttons.
The “Raw Data” button was designed to ensure that a user can see the engineered dataset with the new features on the Web Application.
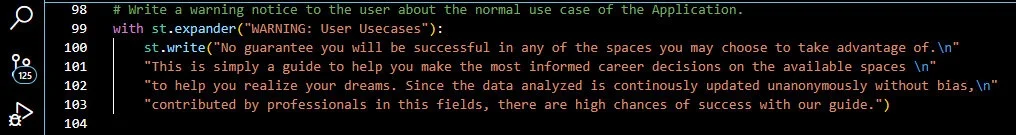
Similarly, the “Warning: User Cases” button was created to warn the user about the application’s purpose and its limitations.
2.2.5. Step 5: Insights generation and presentation in the Web Application.
There were nine insights and recommendations. The Python program code snippets below show how each insight was developed using a Python function. Visit the application to view them by clicking the button at the end of the guide.
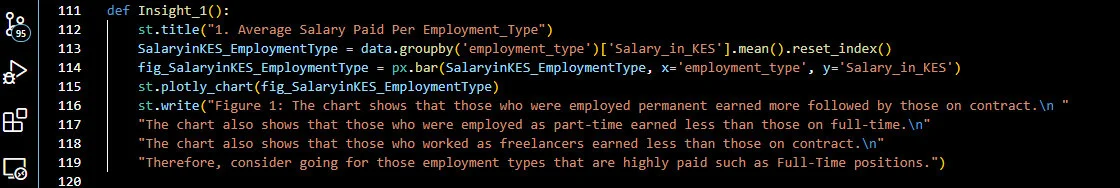
Insight 1: Employment Type code snippet
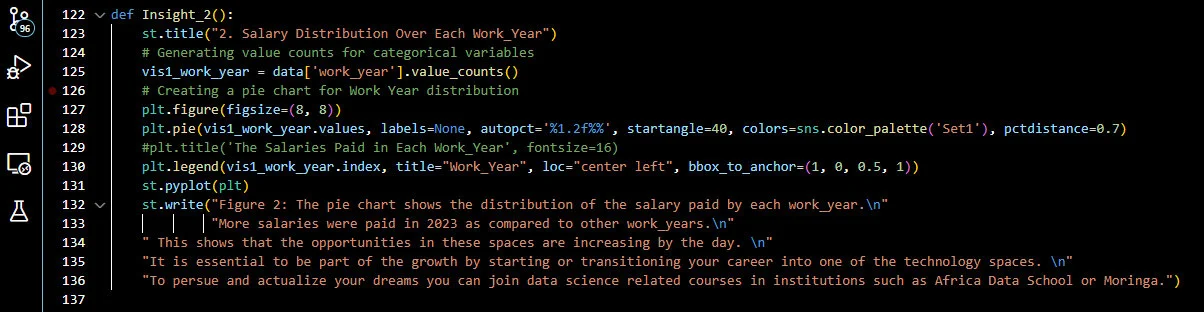
Insight 2: Work Year code snippet
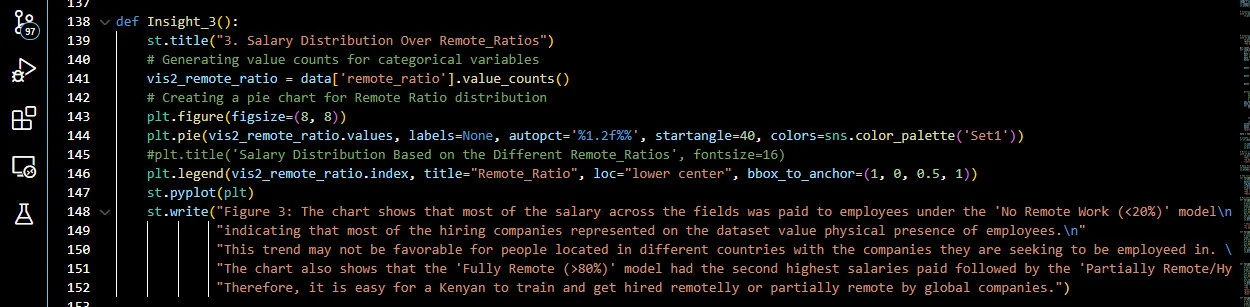
Insight 3: Remote Ratios code snippet
Insight 4: Company size code snippet
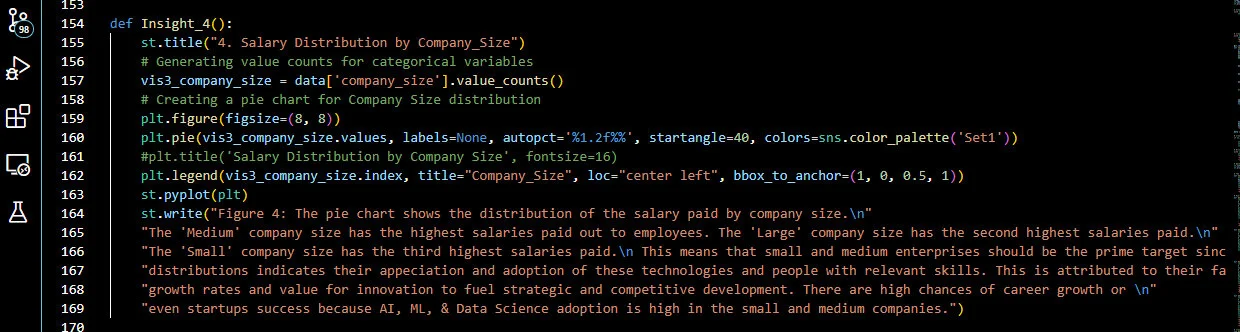
Insight 5: Experience Level code snippet
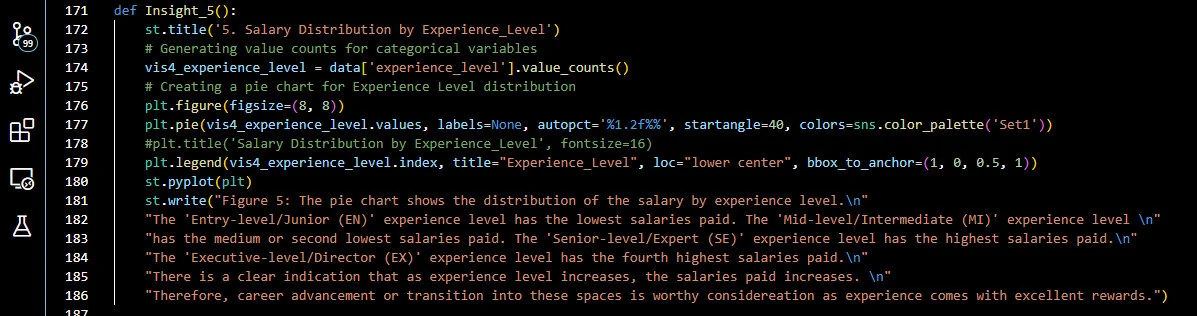
Insight 6: Highest paid code snippet
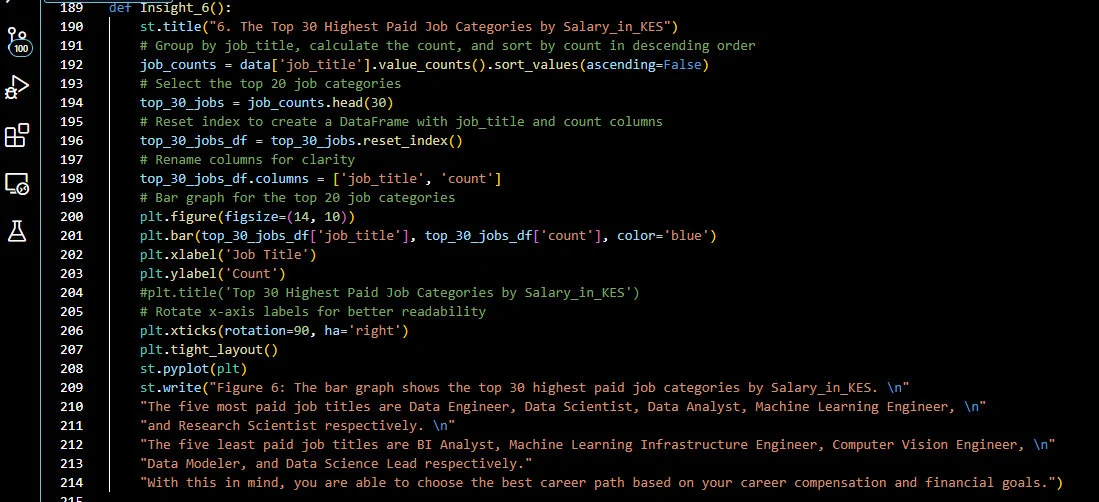
Insight 7: Employee residence code snippet
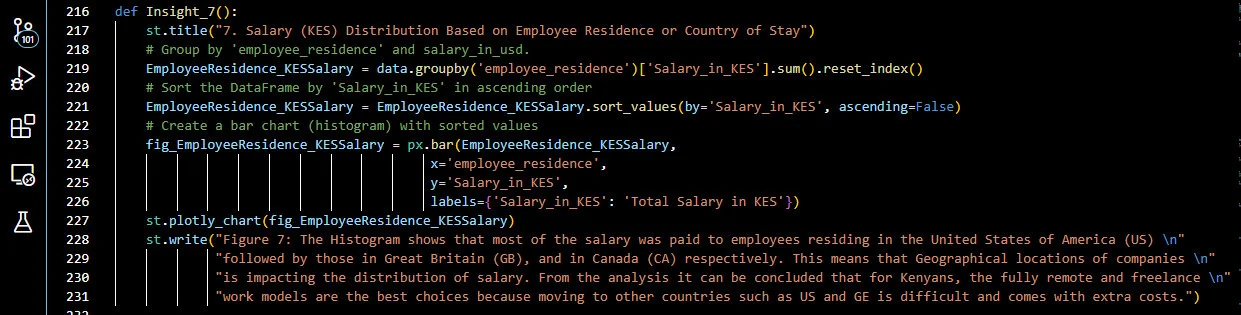
Insight 8: Company location code snippet
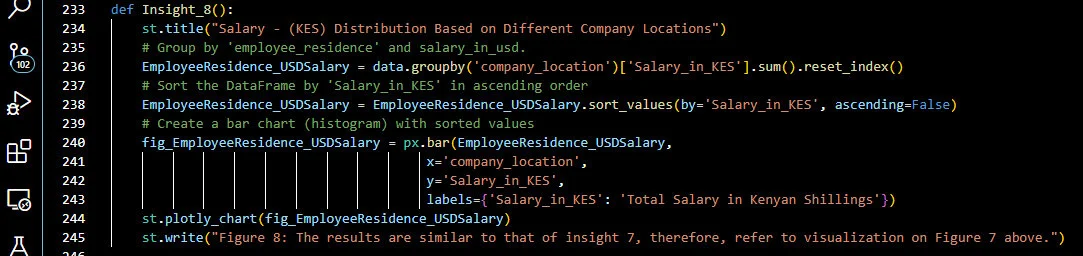
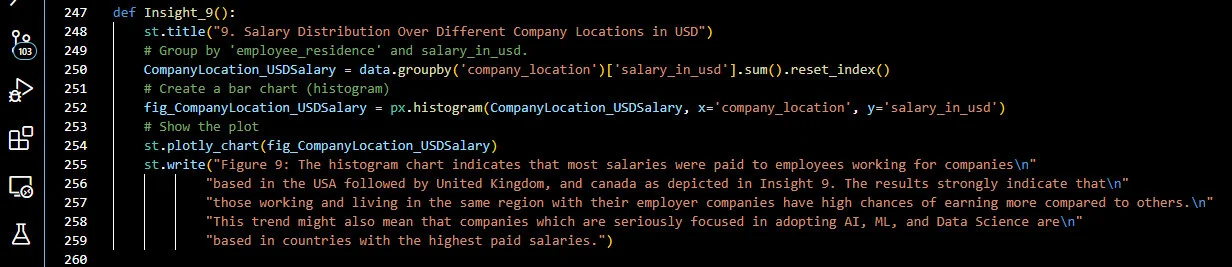
Insight 9: Company location salary distribution in USD code snippet
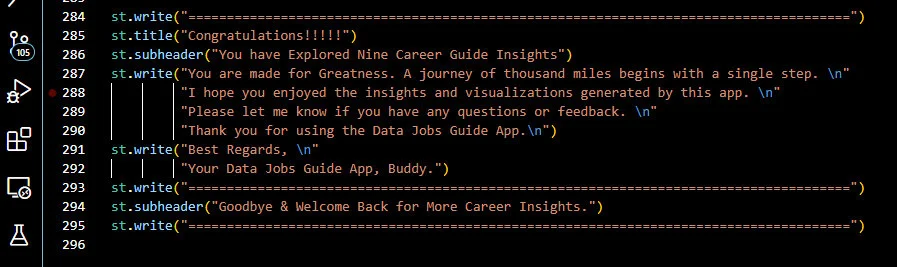
2.2.6. Step 6: Web Application user appreciation note.
After exploring the nine insights, the summary section congratulates the App user for finishing exploring. Additionally, it tells them what they have done and gained by using the application. Finally, it bids them goodbye and welcomes them back to read more on the monthly updated insights.
2.3. Conclusion
By examining the critical analytical dimensions, the project seeks to provide three main things. First, it provides a nuanced perspective on the diverse factors shaping salaries in the AI, ML, and Data Science sectors.
Secondly, armed with these insights, individuals can navigate their career paths with a clearer understanding of the landscape. Thirdly, based on the clear understanding, they will make strategic decisions that enhance success in these dynamic and high-demand fields.
I recommend you access the guidelines with an open mind and not forget to read the user case warning.
Do not wait any longer; access “The Ultimate Career Decision-Making Guide: – Data Jobs” web application and get the best insights. Thus, click the application button below.
The Streamlit Web Application Link:
It takes you to the final application deployed using the Streamlit Sharing platform – Streamlit.io. There are two ways to access the web app. One, click the blue button.
Alternatively, in case the button is not working on your end, do the following. Highlight the link, copy, and paste it directly into the browser’s search bar and hit the search button.
App Link - https://career-transition-app-guide--data-jobs-mykju9yk46ziy4cagw9it8.streamlit.app/